
Planetary Science
Atmospheres in the Outer Solar System
Observing an atmosphere across the electromagnetic spectrum from the visible to the radio reveals information about clouds, hazes, dust, absorbing gases, and temperature at different pressure levels; radiative transfer modeling provides the translation between an observed spectrum and these physical properties of interest. The combination of radiative transfer modeling and multi-wavelength observations with cutting-edge (and sometimes amateur!) telescopes led me to
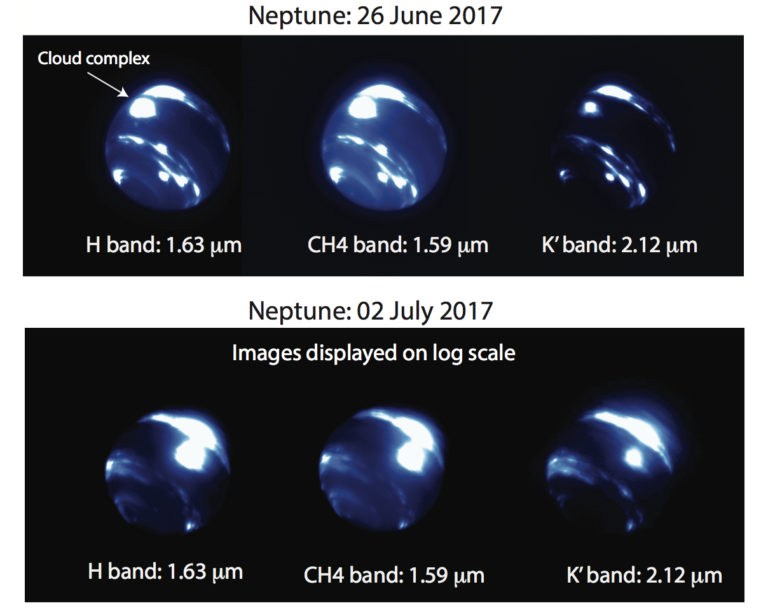
- discover and characterize a unique storm at Neptune’s equator (link), see also this Nature Research Highlight)
- determine isotopic abundances and constrain chemical reaction pathways in Titan (link)
- determine the circulation pattern and gas abundances in Uranus’s middle troposphere (link)
Uranus’s Peculiar Moon Mab
We made the first near-infrared detection of Uranus’s tiny moon Mab (paper link) using the NIRC2 instrument at Keck Observatory. Mab is unique among the Uranian moons because it is associated with (and the presumed source of) the faint, dusty, spectrally blue mu ring. The mu ring’s properties are reminiscent of Saturn’s E ring, which is sourced from Enceladus’s cryovolcanism, and while it seems highly unlikely that a moon as small as Mab has active geysers, alternative explanations also fall short. Our detection of Mab was permitted by an updated “shift-and-stack” algorithm that allowed us to integrate on Mab as it moved across the detector in tens of separate exposures taken over the course of a quarter-night of observing. We showed that like its dusty ring counterpart, Mab’s surface is also spectrally blue, which indicates a surface covered with water ice like Uranus’s mid-sized moon Miranda rather than a surface covered with dark organic soots like Uranus’s other small moons. While this does not resolve the question of the mu ring’s origin, it provides a useful data point for dynamical theories of dust transport between the Uranus system’s moons.
Thermal Emission from the Uranian Rings
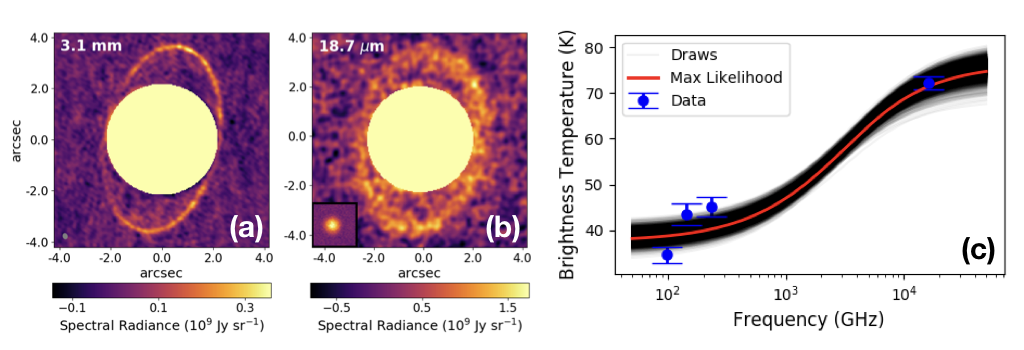
Our ALMA observations of Uranus’s atmosphere serendipitously detected thermal emission from the Uranian ring system for the first time! Some collaborators at the University of Leicester subsequently observed the rings’ thermal emission in the mid-infrared, so we wrote a paper together (link, press release) in which we determined the temperature and filling factor of the rings. We observed the ring system with ALMA again in October 2021 with a factor of 10 higher resolution. These observations will resolve each inner main ring individually; stay tuned for results!
JWST Observations of Io
I’m part of the Early Release Science (ERS) team that observed the Jupiter system with the James Webb Space Telescope (JWST) in 2022. The ERS program tests the capabilities of JWST for bright targets, non-sidereal targets, and targets requiring specific observation timings (e.g., Io in eclipse). Within this large project, my subgroup is using Aperture Masking Interferometry (AMI) to resolve Io’s volcanically-active hotspots and learn about their temperature structure and morphology. Combined with ground-based data from the Large Binocular Telescope Interferometer (LBTI) and Keck Observatory’s NIRC2 imager, we are able to constrain Io’s atmospheric structure and temperature, the temperature and morphology of its hotspots, and the properties of its surface ices.
The Twilight Zone at Keck Observatory
I started the Keck Twilight Zone observing campaign (link to website), a long-term project to take short (15-30 minute) observations of Titan, Uranus, Neptune, and Io at near-infrared wavelengths during twilight hours that would otherwise go unused. I spent six weeks at the Keck headquarters in Waimea, Hawaii in the summer of 2017 developing software tools to make these observations easy enough to plan and execute that the Observing Assistants (OAs) could run them without support from our team. This software included a Python-backed Web tool to show the targets’ positions and trajectories on the sky compared with the telescope’s elevation limits, and csh-based scripts that interacted directly with the telescope and instrument to make running the calibrations and observations a code one-liner. I solicited and incorporated lots of feedback from the OAs who tested those scripts, and the ease-of-use testing paid off: the program has been activated by OAs on over 90 nights since mid-2017. The Twilight Zone project has yielded breakthrough scientific results, including the discovery of a massive storm at Neptunes typically placid equator (Molter et al. 2019a, see also this Nature research highlight), a time series of Io volcanism that constrained tidal heat dissipation models (de Kleer et al. 2019), and an analysis of Neptune’s cloud activity over the past 30 years showing correlations with the 11-year solar cycle (Chavez et al. 2023a, Chavez et al. 2023b). Im currently advising a post-baccalaureate student on a project using Twilight Zone data to track brightness variations in Uranus’s dusty rings, and more images continue to be taken.
Scientific Software
I maintain the following open-source scientific Python software suites, all of which are pip installable, have high test coverage tracked with codecov, and have readthedocs documentation built with sphinx.
pylanetary
The idea behind pylanetary is to bring solar system science tools into the open-source Python / Astropy ecosystem. I, and many of my colleagues, relied heavily on useful code snippets passed down from other solar system scientists to write many of my papers. But these pieces of code were untested, in multiple languages, closed-source, and had many untracked dependencies. I want to fix that.
At present, two main packages are reasonably well-supported:
- navigation: Tools to make and use ellipsoidal models of planets/large moons. This subpackage projects planet models into arbitrary observing geometries and pixel scales, compares those models with observational data, assigns latitudes, longitudes, and emission angles to observational data, and projects images onto latitude-longitude grids.
- rings: Tools to model planetary ring systems. This subpackage projects ring models into arbitrary observing geometries and pixel scales, compares those models with observational data, and makes radial and azimuthal profiles of observed rings.
The eventual goal is to become Astropy-affiliated, but that is a long way off.
nirc2_reduce
nirc2_reduce provides software for calibration, imaging, and analysis of infrared images of solar system objects. Features include:
- Dark subtraction, flat-fielding, cosmic ray removal
- Distortion correction and application of astrometry solutions
- Easy reduction of the famous NIRC2 bxy3 dither pattern (among other supported dithers)
- Flux calibration and photometry
- Flexible infrastructure for applying new dither patterns, filter passbands, distortion and solutions, etc. for use cases on new telescopes
This package has been applied successfully to NIRC2, OSIRIS, and Lick ShARCS data.
Example images of Solar System planets made using this pipeline are available at the Keck Twilight Zone website.
shift_stack_moons
As discussed above in the Uranus’s Peculiar Moon Mab subsection, shift_stack_moons increases the signal-to-noise ratio on small moons around planets in multi-frame observations according to the expected position of the moon from JPL Horizons.
Ring Node Query Tool
I contributed a tool to Astroquery that queries the Planetary Data System (PDS) Ring Node ephemeris tools. The readthedocs page is here, and examples of how this is useful are found in the pylanetary ring modeling submodule.
Climate Change
Storm Evolution in the U.S. East/Midwest
Modeling the clouds and rainfall associated with storms over land in the extratropics remains a substantial challenge for state-of-the-art global climate models (GCMs), in part because they cannot resolve deep convection. Recent advances in computing have enabled the first global, non-hydrostatic, convection-resolving simulations, or GCRMs. Although they can so far only simulate a few days at a time, GCRMs have already shown promise in solving at least some of the persistent issues GCMs face (see, e.g., Caldwell et al. 2021). The very high space and time resolution of this new class of models requires new observational data to validate model output. During my Ph.D., I helped put together a huge new combined dataset of precipitation, cloud properties, and large-scale flow variables at hourly, 8-km resolution over the Eastern and Midwestern United States from 2002 to present. These data enable us to
- evaluate both cloud and precipitation behavior of GCRMs at sub-10 km scales
- simultaneously probe convective parameterizations and microphysics parameterizations in climate models
- track storms throughout their evolution; build accurate IDF curves
- see how the large-scale meteorological flow dictates and is altered by storm behaviors
- build an observation-based stochastic parameterization scheme
Observations of Extreme Precipitation
My recent work focuses on extreme weather and its relationship with climate change on Earth as part of the CASCADE collaboration at Lawrence Berkeley Lab. Understanding the response of the precipitation system to climate change is crucial for urban planners, civil engineers, and farmers, who design infrastructure and make decisions based on the amount of rain that will fall in an extreme event. My most recent paper (link) made use of Doppler radar observations to improve the way rainfall is quantified, with a particular eye toward extreme rainfall events. I’m now working on combining the radar data with ERA-5 reanalysis data and GOES satellite imaging to better understand why climate models tend to produce too little heavy precipitation.